Sociogram Template
Sociograms are one of the sociometric techniques methods used for identifying and analyzing interpersonal patterns within social group structures.
In essence, sociograms help you visualize groups in graph layouts. Using sociograms in the classroom or office setting is particularly helpful for understanding group dynamics and how people relate.
You can easily create sociograms using a done-for-you sociogram template.
Get your free sociogram template from Sometics below.
Our template provides a clear blueprint for generating sociograms. It is simple to customize according to your situation and makes data easy to interpret.
Whether you prefer to draw your own sociogram or download a template, it helps to understand the various components involved. This way, you can create a more accurate representation of your information.
Overview of Sociograms Components
There are three main components of sociograms:
Symbols
The two main symbols in all sociograms include vertex (or nodes) and edge (or lines). Each stands for something different.
The vertex represents participants, whereas the edges reveal their connections. We discuss vertices and edges in detail on our sociogram examples page.
-
Vertex Symbols and Their Meaning
You can use different shapes to represent participants on a sociogram. However, the common forms many sociometrists use when drawing sociograms include:
Circles to represent female members

Triangles to represent male members

Concentric circles or triangles to represent female and male members from a different group


When selecting a template, consider the shapes of the vertices to ensure you pick one whose nodes reflect your group’s entities.
But this is not compulsory. Often, any form can do unless creating an egocentric sociogram.
For egocentric sociograms, use a star to represent the ego or focus of the analysis.
-
Lines Symbols and Their Meaning
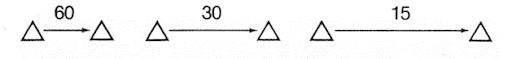
Different types of edges or lines indicate the nature of various social relationships. Here is a summary of what each line symbol means.
Other types of lines can show different aspects of participants’ relationships.
For example, a wavy line could mean that the participants share a peaceful, happy relationship. But a jagged line may indicate an unhappy and tense relationship.
The width of the lines also matters. They indicate the strength of the connections. Thin lines can mean that the relationship two or more group members share is weak and thick lines show strong relationships.
With that said, always consider the types of lines you use so you accurately represent your group or team's connections.
Numbers
On a sociogram, numbers denote something different depending on where they appear. If they are in the vertex, they represent a count of the participants.
However, if they are on the line symbol, they represent a quantitative criterion, for example, time spent. In this case, the numbers are critical to the analysis or interpretation of the sociogram.
Here are examples of numbers accompanying line symbols:
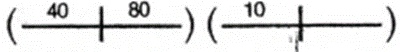
If you have a quantitative criterion to represent on your sociogram, your template should allow you to add this information easily.
Patterns
Since sociometry and sociograms reveal social networks, patterns are essential components of the diagrams. The most common patterns you are likely to encounter on a blank sociogram template include:
Each pattern represents a type of social network, also known as sociometric configuration. Consider the best layout to present all your data set clearly.
We recommend selecting an online sociogram template with the star configuration if you want to create an egocentric sociogram. It will be easier to edit and create your chart.
How to Make a Sociogram
It is simple to create a sociogram once you have gathered data using a sociometric questionnaire.
Before you start, remember that the fewer the number of crossing lines, the more easy-to-read and interpret your sociogram will turn out.
So every move you make as you draw your chart should be geared towards minimizing the number of crossing lines to promote readability.
With that in mind, begin to create your sociogram. Start with a blank page and draw a vertex in the middle to represent the central character (the person most frequently chosen).
Then draw vertices or nodes representing the other participants following the number of times chosen. You may include the names of all participants in their respective vertices to prevent confusion.
Individuals chosen several times by their team members appear close to the central character, although at a safe distance. You want to leave enough space for drawing the lines of connection.
On the other hand, those chosen a few times will appear further from the center. Once you have placed all group members on the page, start drawing lines or arrows to establish their connections. Be sure to use the correct type of line for each relationship in order to ensure correct sociometric status.
Erase and redraw the lines and vertices as much as you need to ensure the sociogram is readable.
Create a Sociogram With Sometics’ Free Sociogram Template
Alternatively, create a sociogram by editing Sometic’s free sociogram template.
Enter your information into the form to create an eye-catching sociogram that you can download as a sociogram template (pdf). Edit your diagram and reuse the template as much as you wish.